
The Analytics page
What each number counts, and which of them mean anything.
Analytics in the sidebar covers every clone.

Two filters sit at the top: a clone picker and a date range, which defaults to the last 30 days. Every figure on the page respects both, so a number that looks wrong is usually a filter you forgot you set.
The four headline numbers

| Metric | What it counts |
|---|---|
| Total Conversations | Separate chat sessions, not messages |
| Contacts Captured | People who gave you their details |
| Total Earnings | Revenue, if you charge for access |
| Conversion Rate | Share of conversations that became a contact |
Activity by Day
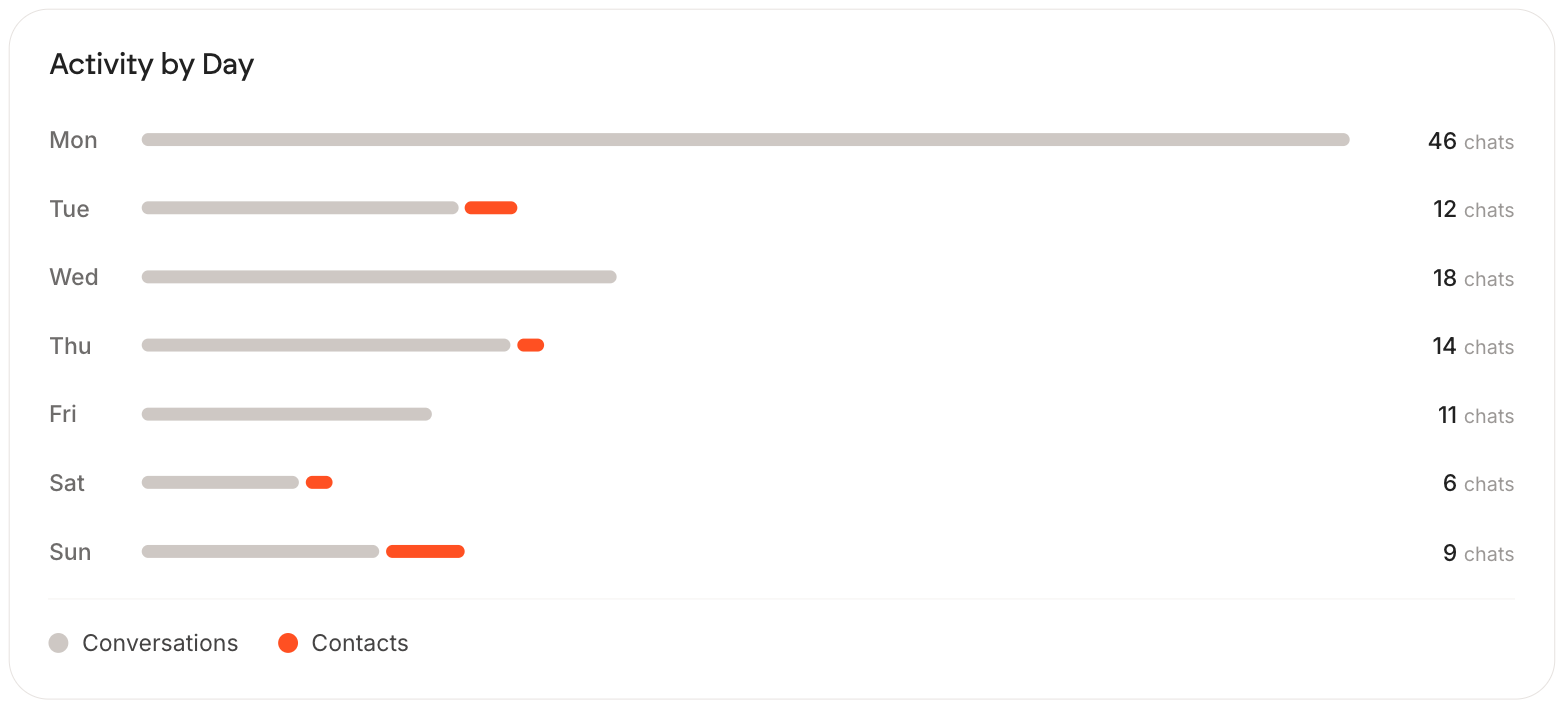
Conversations and contacts by day of the week. Useful for working out when your audience actually shows up, which is rarely when you assume.
A single tall bar usually means one burst rather than a pattern: a newsletter went out, or you posted somewhere. Give it a few weeks before you read anything into the shape.
AI Clone Performance
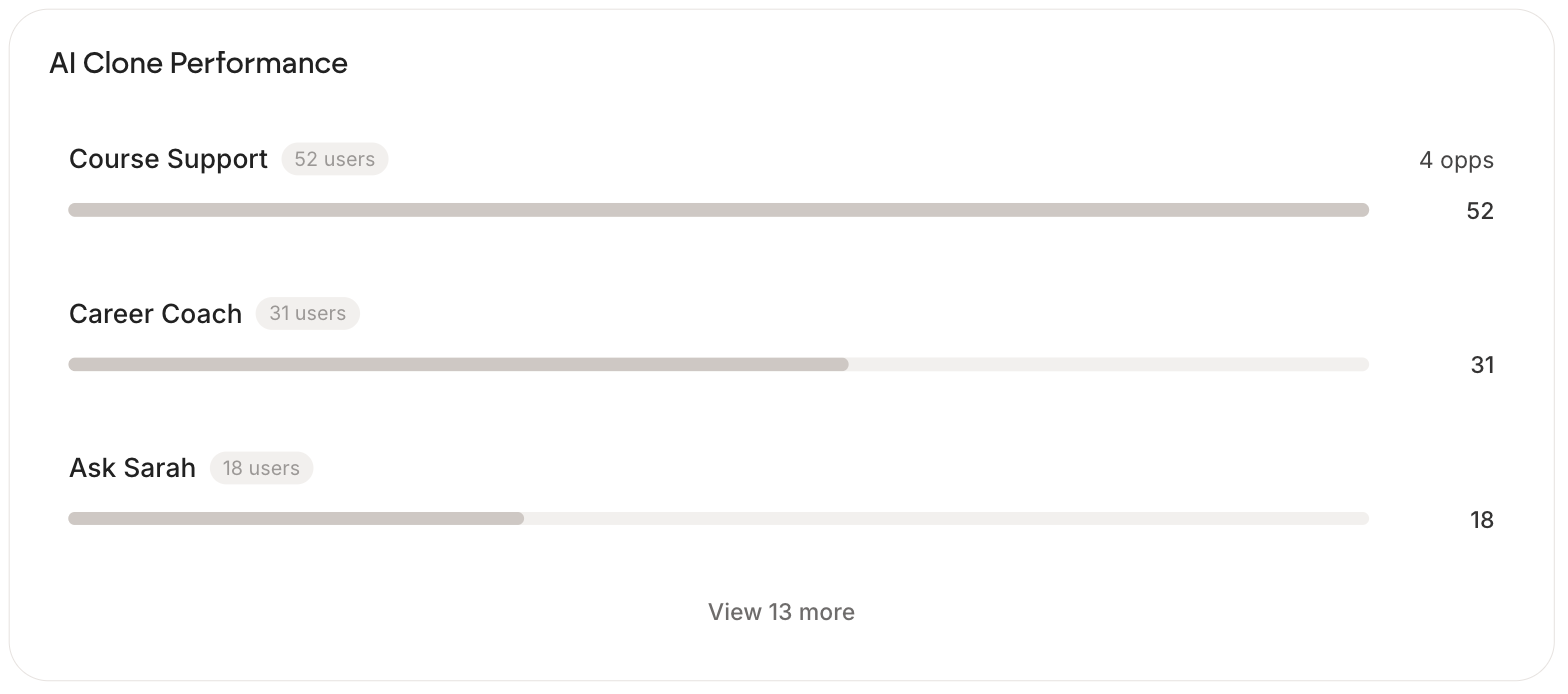
Each clone with its user count and opportunities. If you run several, this is where you see which one is doing the work.
A clone reading zero is not necessarily a bad clone. It is usually one that is switched off, or one nobody has been sent to. Check placement before you rewrite anything.
Period Summary

Raw totals for the selected window. The gap between Page Views and Conversations is the most useful comparison here: it tells you how many people saw your clone and did not type anything.
A big gap means the page is not inviting people in. Your greeting and your suggested questions are the two things that change it.
Key Insights

Engagement, the average conversation length, is the most honest number on the page. Two messages means people asked once and left. Four or five means your clone is holding a real conversation.
Do not compare clones that sit in different places. A clone embedded on a busy page will beat one behind a link in a bio no matter which is better written.